


ラズパイで測定したデータなどをグラフ表示したい時に便利なのが「matplotlib」である。本来、このpythonライブラリは科学技術計算用だが、2次元グラフのプロットが出来る。
| <testgraph.py> | ||
#!/usr/bin/python
#-*- coding:utf-8 -*-
import matplotlib.pyplot as plt
import time
logpath  = '/home/pi/Graph/'
logfile   = 'logdate.log'
graphfile = 'graph.jpg'

#******* グラフを生成する関数 ***********
def makeGraph():
    x  = [1, 2, 3, 4]
    y1 = [5.5, 6.2, 9.6, 10.5]
    y2 = [4, 5, 6, 7]
    fig, ax1 = plt.subplots(1,1, sharex=True, figsize=(6, 4))
    ax2 = ax1.twinx()
  #グラフ描画
    ax1.plot(x, y1, 'r')    #color=red
    ax2.plot(x, y2, 'b')    #color=blue
  #ラベル類表示
    ax1.set_xlabel('Time')
    ax1.set_ylabel('Data1', color='r')
    ax2.set_ylabel('Data2', color='b')
    ax1.set_title('Two Data View')
    fig.savefig(logpath+graphfile)
    fig.show()

#********** メイン関数 *******
def main():
    makeGraph()
    time.sleep(5)

#******* 起動 *****
if __name__ == '__main__':
    main()
|
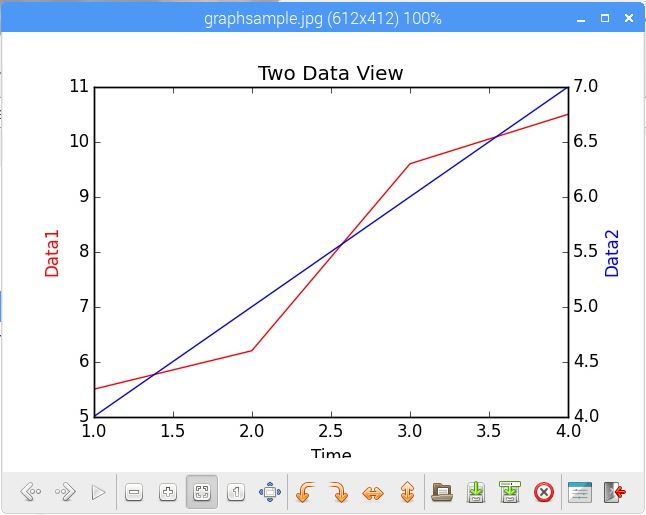 testgraph.pyの実行例 |
 |
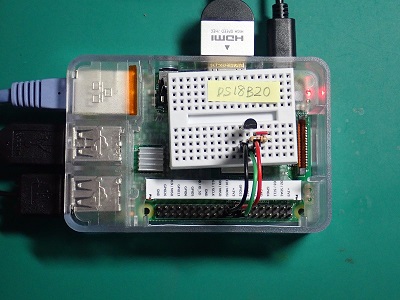 |
| ワンワイヤー温度測定の確認 | DS18B20温度センサ (プルアップ抵抗値は4.7kΩ) |
| <w1therm.py> | |
import glob, time

base_dir = '/sys/bus/w1/devices/'
device_folder = glob.glob(base_dir + '28*')[0]
device_file = device_folder + '/w1_slave'

def read_temp_raw():
    f = open(device_file, 'r')
    lines = f.readlines()
    f.close()
    return lines

def read_temp():
    lines = read_temp_raw()
    while lines[0].strip()[-3:] != 'YES':
        time.sleep(0.2)
        lines = read_temp_raw()
    equals_pos = lines[1].find('t=')
    if equals_pos != -1:
        temp_string = lines[1][equals_pos+2:]
        temp_c = float(temp_string) / 1000.0
        return temp_c

try:
    while True:
        print('temp=%2.1f' % read_temp())
        time.sleep(1)
except KeyboardInterrupt:
    pass
|
配線図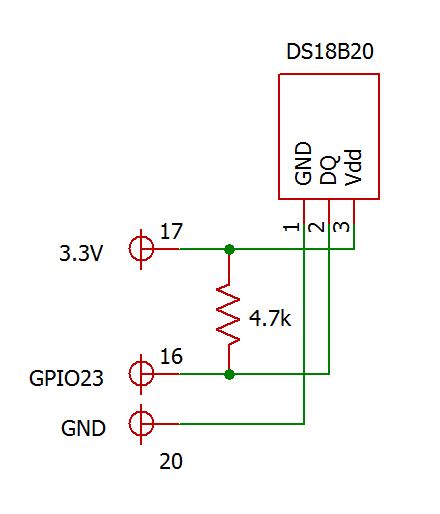 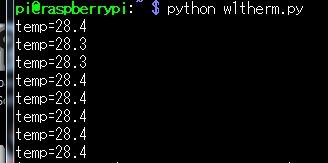 w1therm.pyの実行例 |
| <tmp18b20.py>(CSVファイルを作成) | <tmpplot.py>(CSVファイルをプロット) | |
from datetime import datetime
from time import sleep
import csv
import glob

base_dir = '/sys/bus/w1/devices/'
device_folder = glob.glob(base_dir + '28*')[0]
device_file = device_folder + '/w1_slave'
dtFormat =  '%Y-%m-%d %H:%M:%S'

def read_temp_raw():
  with open(device_file, 'r') as tf
    lines = tf.readlines()
  return lines

def read_temp():
  lines = read_temp_raw()
  while lines[0].strip()[-3:] != 'YES':
    time.sleep(0.2)
    lines = read_temp_raw()
  temp_pos = lines[1].find('t=')
  if temp_pos != -1:
    temp_string = lines[1][temp_pos+2:]
    temp_c = float(temp_string) / 1000.0
    return "%2.1f" % (temp_c)

#main
print('save tempdata.csv start')
try:
  while True:
    with open('tempdata.csv','a') as f:
      now = datetime.now()
      time = now.strftime(dtFormat)
      tcel = read_temp()
      row = [time, tcel]
      writer=csv.writer(f)
      writer.writerow(row)
    print(row)
    sleep(60)

except KeyboardInterrupt:
  print("end")
  pass
|
import csv
from datetime import datetime as dt
import matplotlib.pyplot as plt
from matplotlib.dates import DateFormatter

dtFormat =  '%Y-%m-%d %H:%M:%S'
time=[]
temp=[]

with open('tempdata.csv','r') as f:
  rd = csv.reader(f)
  for row in rd:
    print(row)
    trstime = dt.strptime(row[0], dtFormat)
    time.append(trstime)
    temp.append(float(row[1]))

fig, ax = plt.subplots()
ax.plot(time, temp, color="red")
plt.title("Termperatur Plot Test")
plt.xlabel('time')
plt.ylabel('tmp(c)'))

myFmt = DateFormatter("%H:%M")
ax.xaxis.set_major_formatter(myFmt)
fig.autofmt_xdate()
plt.show()
|
|
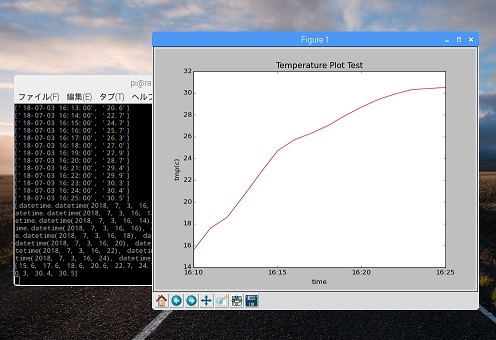 グラフ表示例 (標準画面にデータリストも表示) |
 |
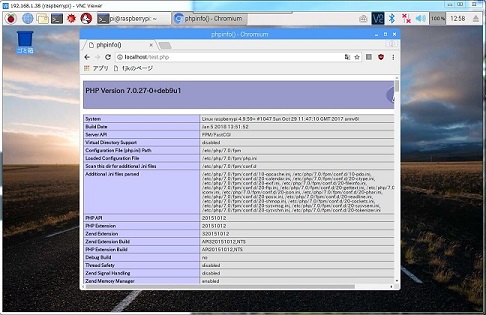 |
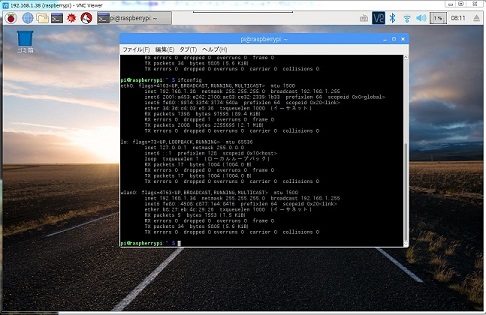
| ifconfig(eth0、wlano共正常動作) | phpinfoの出力例(php7.0) |
 |
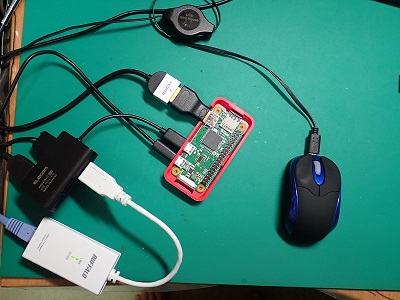 |
| test.phpの実行画面(有線LAN接続) | 有線LANアダプタ(左下)とラズパイZERO |
 |
 |
 |